
Tracking software delivery and product velocity
I’ve recently had a few discussions about velocity.
 Photo by Mark Tuzman on Unsplash
The discussions were around how a company’s product velocity has been decreasing and how they aren’t delivering as fast as they need to. This is always a hot topic internally, as founders, leaders and teams are always looking to increase product velocity.
While the discussions specifically talked about product velocity, they were talking more broadly about the ability to deliver value to customers.
Agile made the term velocity popular. It’s defined as unit of work over an interval (usually sprints).
The tricky part with velocity is defining unit of work - as it is usually a relative estimation, eg. story points. If estimations remain consistent over time, then velocity can be compared over time (they don’t need to be accurate, just consistent). Over a few sprints or months this can be accurate, but over longer periods the consistency declines. Estimates change as the team, projects, product and type of work change.
The need for additional metrics
Without quality metrics, it’s all opinion. Usually it’s the loudest voice or most senior opinion that reigns, not the truth. Something I’ve experienced many times when I wasn’t tracking the right metrics.
If velocity is flawed as a metric, what data can we use to track software delivery?
All metrics can be flawed, so we want to combine multiple metrics across the full SDLC, hopefully creating a holistic picture. This should reduce bias and errors within individual metrics and give more reliable data to track software delivery over longer periods.
- Customer Satisfaction: NPS or similar to measure customer satisfaction. No point efficiently delivering features that customers don’t like.
- Engineering: Lead Time - The elapsed time between identifying a feature and delivery of the feature.
- Quality: Issues found in production are a great indication of quality and a sustainable engineering process.
- Production: Mean time to resolve or repair (MTTR) - how long it takes to address an issue.
Customer Satisfaction - NPS
Most important is to ensure we’re headed in the right direction. There’s not much value in efficiently delivering features that customers don’t use or need!
There are plenty of metrics that measure customer satisfaction. While I believe NPS is flawed, it’s no more of less flawed that other metrics and is very easy to track.
Engineering - Lead Time
Taken from Lean manufacturing principles. In the software world it’s the elapsed time between identifying a feature and delivery of the feature. The great thing about measuring lead time is that is encourages many good engineering practices:
- Working in smaller batches - reduces risk & work in progress (WIP), increases throughput & iteration.
- Encourages frequent deployment - as lead time measures when value is delivered to customers.
- Backlog management - Evaluating adding items to a backlog & removing items that are not likely to ever be delivered.
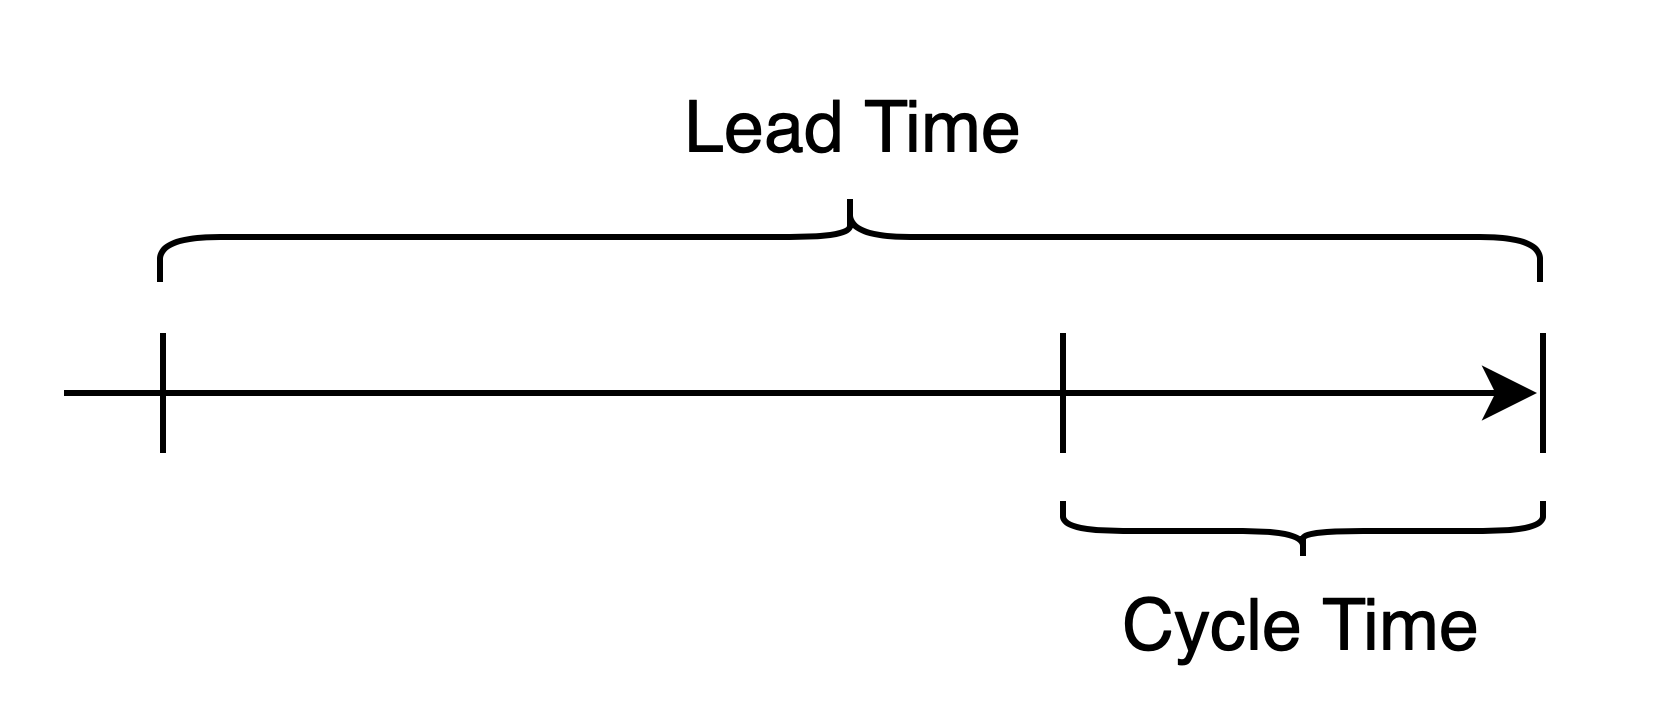
Lead time can be optionally divided up into Cycle Time - the time between development starting and delivery. Measuring both Lead and Cycle allow tracking the time from the 3 core points of views - the customer/user (total time), product team (health of backlog) & engineering (time taken to build & deploy).
While tracking lead time encourages deployments, it’s also valuable to track deployment frequency as another individual metric.
Quality - Issues found in production
Tracking quality can be a simple as recording how many bugs or issues have been found in production. If this goes up, the warning bells should start to ring loudly.
Quality can also be tracked by deployment issues. Deployments need to be routine, tracking issues caused by release can give further insight into quality.
Production - MTTR
Once an issue is found in production, how long does it take to resolve? This is mean time to resolve (or recovery) - MTTR.
What’s great about MTTR - like the above metrics - gives insight into the wider software engineering processes as well as production and customer impact.
Data driven decisions
I like how these metrics all overlap & encourage a DevOps culture.
They each give insight into the full product engineering process as well as each critical component (customer satisfaction, engineering efficiency, quality & production). The overlap increases the quality of each metric and increases the ability to track over time. Which is the whole aim — tracking software delivery or velocity over time.
When tracked over time, they give an early indication of software delivery issues or changes in product velocity. All based on real data, not opinion or hearsay!